Global headcount
Workforce across Latin America, EMEA, North America and APAC.


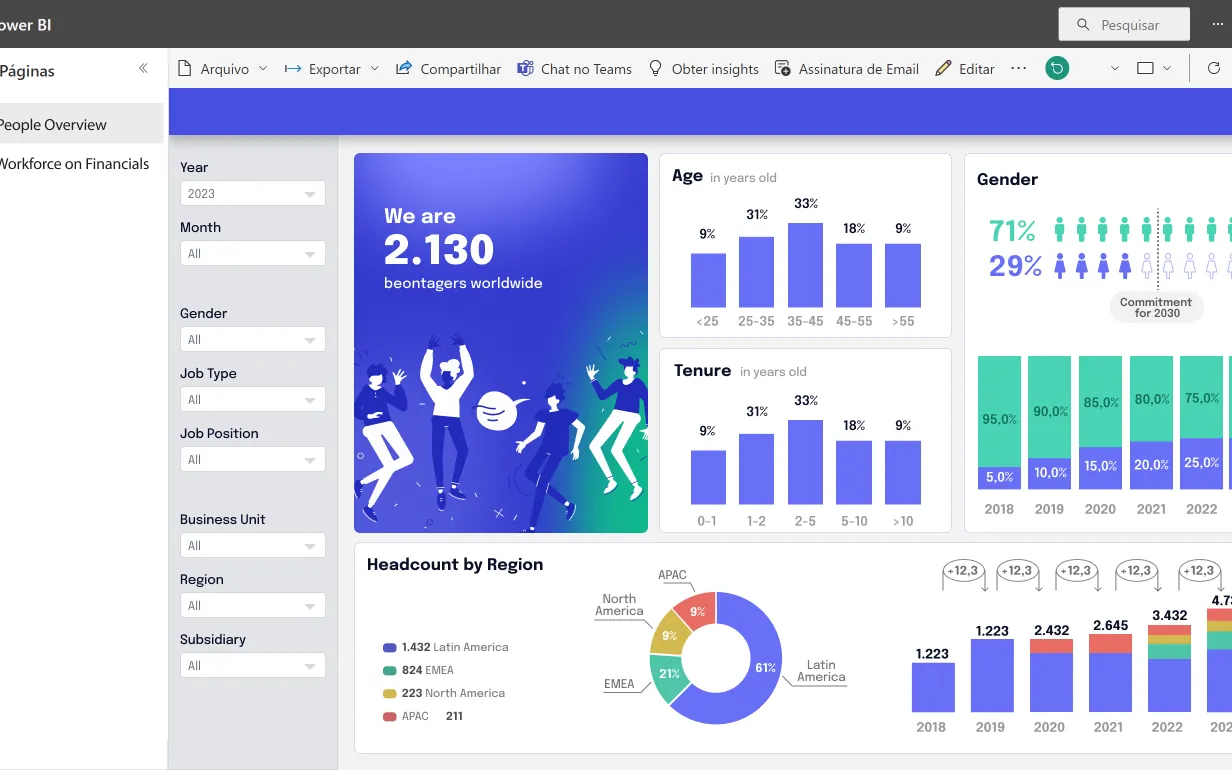
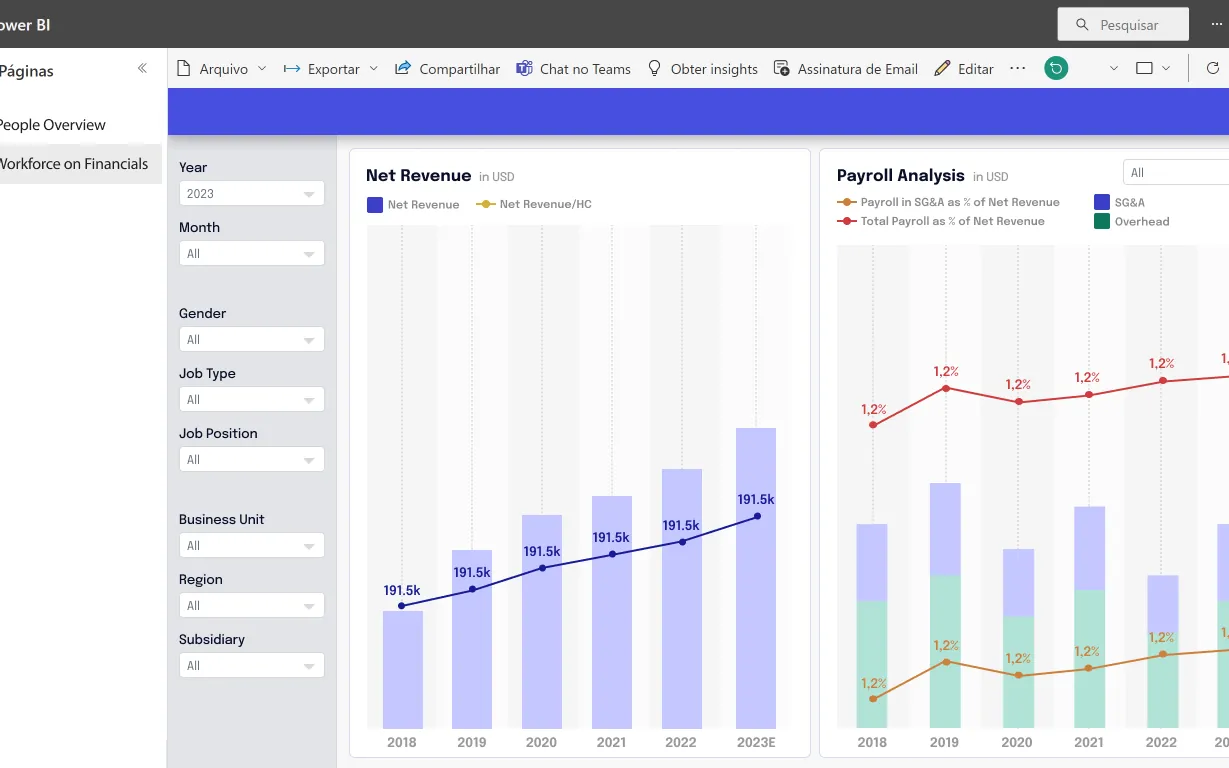
Beontag wanted leadership to understand its global workforce at a glance. The dashboard combines a people overview — age, tenure, gender and headcount by region — with workforce-on-financials views that relate payroll to revenue.
HR data existed but wasn’t presented in a way executives could use. Diversity commitments and regional growth needed to be visible and comparable over time.
Workforce across Latin America, EMEA, North America and APAC.
Gender balance tracked against a 2030 commitment.
Payroll analyzed as a share of net revenue.
01
Visual references and existing reports gathered.
02
Headline numbers and breakdowns selected with HR.
03
People overview and financials pages designed.
04
Beontag’s identity and illustration style applied.
A branded headline number, age and tenure distributions, gender evolution, headcount by region and year, and net revenue vs payroll analysis.
Headline numbers lead every page.
Diversity commitments visible year over year.
People and financial data side by side.