Complex network
Projects, institutions and individuals interconnected.


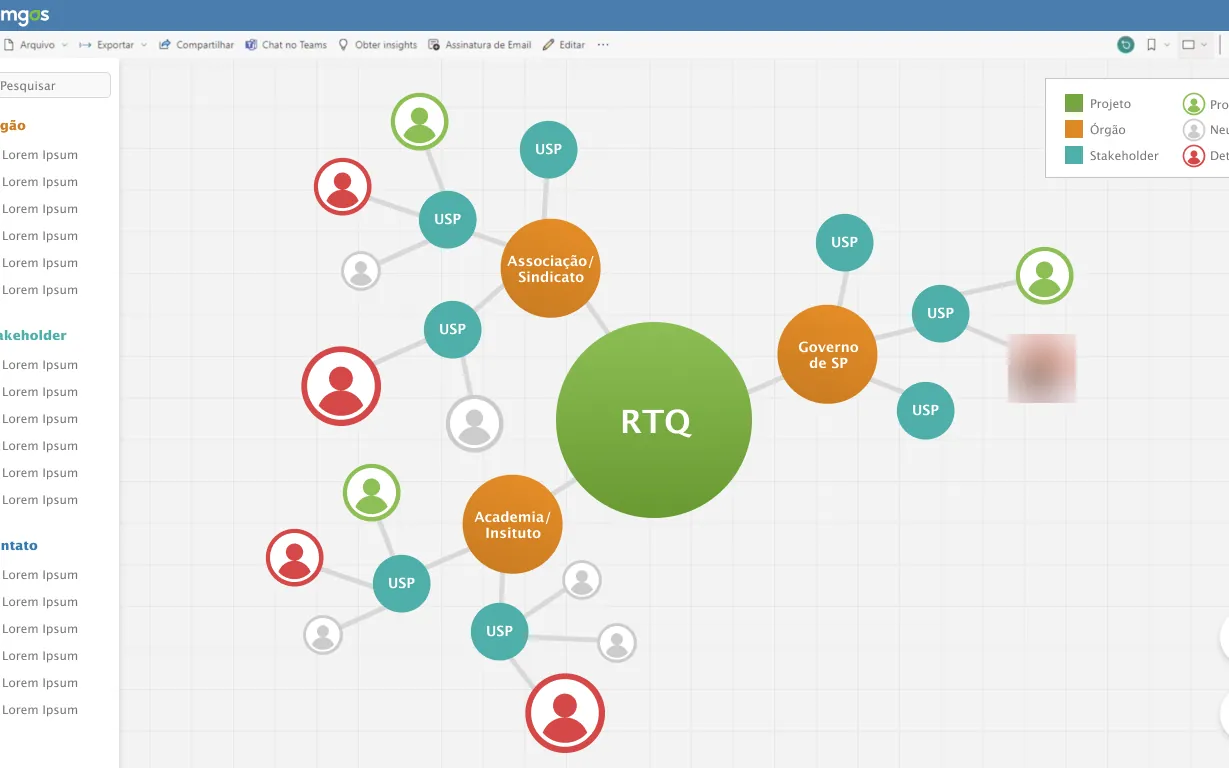
Comgás’ institutional relations team tracks a complex network of government bodies, associations, academia and public figures. This BI project turns that network into an interactive map showing how each stakeholder relates to a project — and whether they promote, are neutral to or oppose it.
Stakeholder knowledge was spread across documents and profiles. The team needed a visual way to understand influence and positioning across agendas such as infrastructure, concessions and the energy transition.
Projects, institutions and individuals interconnected.
Promoter, neutral and detractor status at a glance.
Topics such as energy transition and infrastructure investment.
01
Organizations, stakeholders and agendas mapped.
02
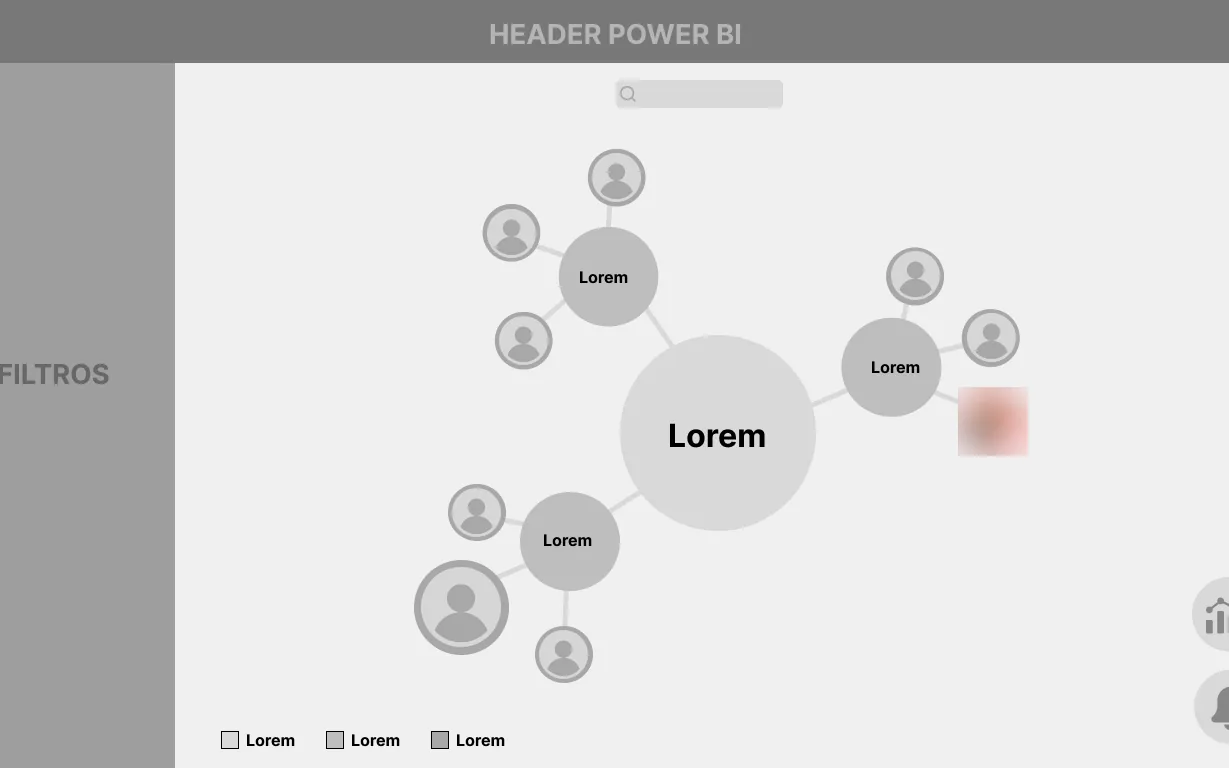
A network-graph concept with filters.
03
Color-coded nodes by type and positioning.
04
Stakeholder detail views with background and agendas.
A network graph with the project at the center, organizations around it and stakeholders color-coded by positioning, with filters by body, stakeholder and contact.
Team insight captured in one tool.
Positioning visible before every meeting.
Effort directed where influence matters.