Many requirements
Interviews captured needs from planning, control and finance.


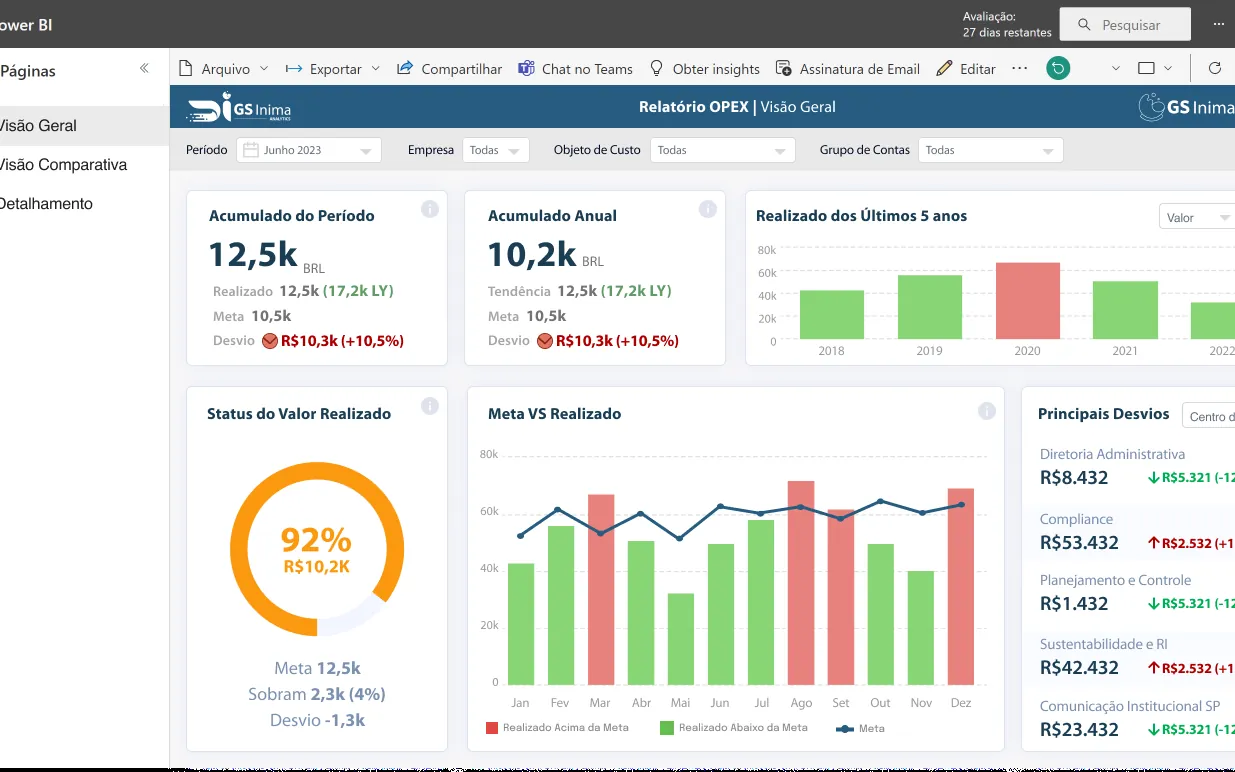
GS Inima’s planning and finance teams needed to track operating expenses against targets across the holding and its units. The report offers an overview, a comparative view and a detailed drill-through, built from interviews with each analyst and coordinator.
Analysts, coordinators and finance leaders each needed different cuts of OPEX — by area, unit, cost center or material — with justifications for deviations.
Interviews captured needs from planning, control and finance.
Deviations had to be obvious, month by month.
From the holding view down to supplier and material.
01
Requirements collected and validated per stakeholder.
02
What the data could and couldn’t support, flagged early.
03
Overview, comparative and detail pages.
04
v2 adjustments after stakeholder review.
Big numbers for period and annual totals, target vs actual charts, a five-year history, top deviations and color-coded comparative tables with justification entries.
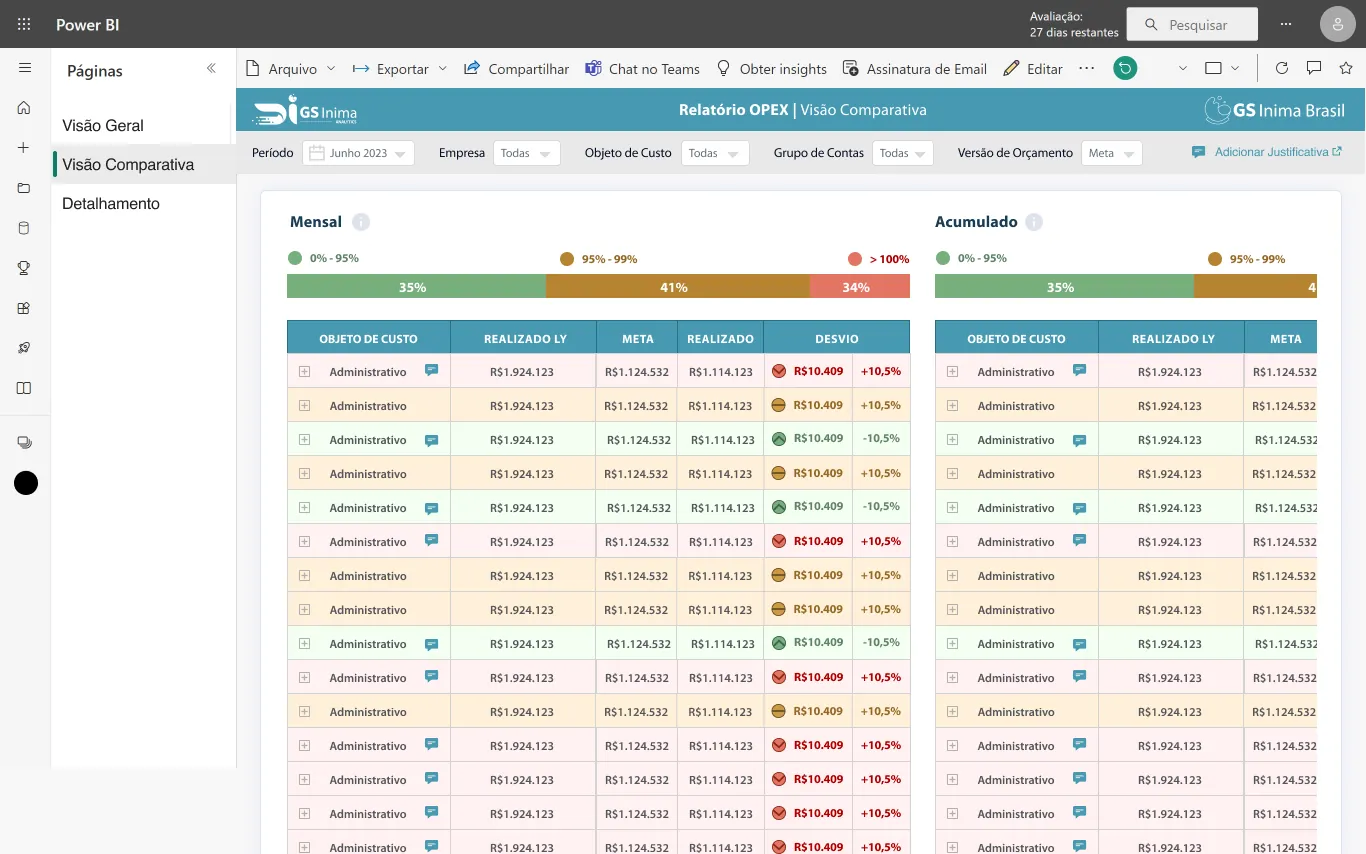
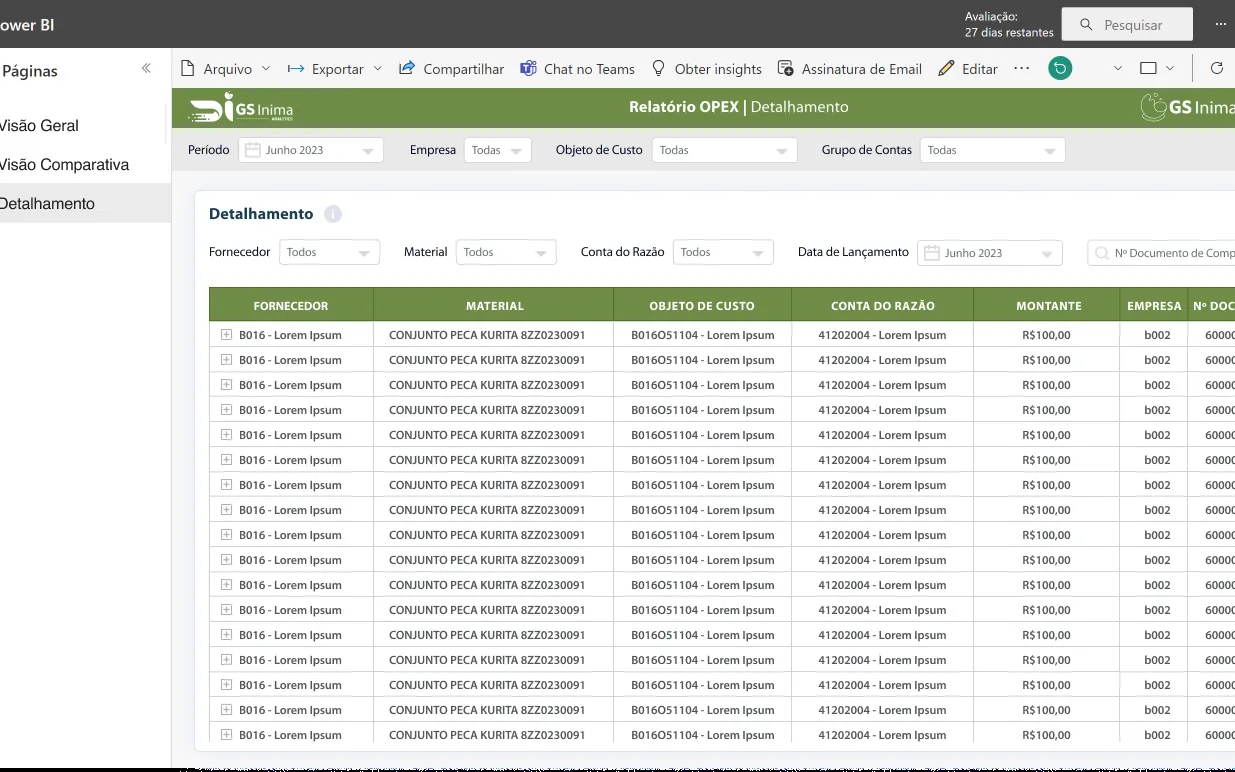
Over- and under-budget items stand out.
Justifications captured next to the numbers.
Holding and units in a single report.